Showing posts with label gdb. Show all posts
Showing posts with label gdb. Show all posts
The Basic Principles of Remote Debugging
When GNU Debugger is running on one machine and the program being debugged on another – this is called remote debugging. Commonly GNU Debugger is running on a classic PC while the program being debugged is running on some sort of embedded board / or in our case on a ZX Spectrum.
Both sides run some sort of debugger code. PC side runs full scale GNU Debugger while ZX Spectrum side runs something called a GDB Stub / older name for this would be a monitor. Both communicate with each other via the serial line.
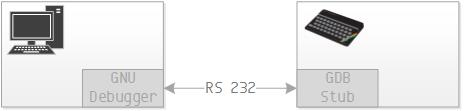
The GNU Debugger for Z80 on PC side knows everything about Z80: the registers, the instructions, the address space. It also knows everything about the debugged program because the debugged program is first loaded into GNU Debugger on PC side and only then sent to ZX Spectrum via serial line by GNU Debugger using special protocol. So the GNU Debugger has the opportunity to examine program’s symbolic information and obtain address of every variable and every function within the program.
Having all this knowledge about the debugged program it only needs a few services from the real hardware on which the program runs to completely control its execution. Providing these simple services is a task for the GDB Stub.
Another example would be watching a value of a variable of program loaded in GUI on a PC. GNU Debugger already knows the type of the variable and on which memory address it resides on a real hardware. Because both information can be obtained from program’s symbolic information. So the GDB Stub service on the real hardware only needs a function to read a byte array of certain length from certain location.
- setting a breakpoint at certain address by writing an instruction that returns control to the debugger (RST) there;
- overwriting breakpoints by program’s code on continue,
- returning the values of all registers.
Remote Debugging using FUSE ZX Spectrum Emulator
Remote debugging of code running on an emulator requires a bit more effort. First the serial protocol on ZX Spectrum is converted to named pipe protocol on Unix. Escape sequences are inserted into named pipe data stream to separate data bits from control bits. This makes direct stream communication with the GNU Debugger impossible due to data corruption. And as if this was not bad enough – the GNU Debugger does not speak named pipes. It only “speaks” RS232 and IP. The solution is to write a PC program which talks to both sides in their own language. It communicates with GNU Debugger using IP protocol and with FUSE using named pipes and escape sequences.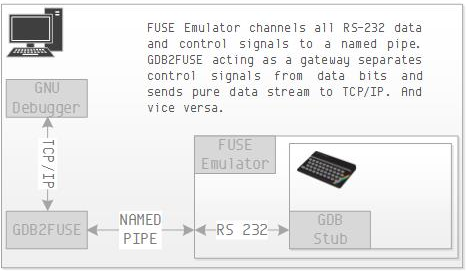
This program is called GDB2FUSE. It has been added to the yx repository. So clone or pull the yx repository to your working folder again. Then go to subfolder yx/tools/gdb2fuse and do make. It will build the command line tool that you need. You may want to copy it to your /usr/local/bin for frequent use.
The GDB Stub for ZX Spectrum
Before we can start debugging we still need to port GDB Stub. The original source code that shipped with gdb-z80 was created for qemu z80 architecture and requires some modification to work on ZX Spectrum.
Primarily it requires us to write serial read and write procedures in a way to trick the buggy FUSE Emulator to.
We also need to change breakpoint command because the original gdb-z80 uses RST8 jump instruction for that and on the ZX Spectrum this is reserved for Interface 1 calls. And we do need Interface 1 because serial port is part of it.
Primarily it requires us to write serial read and write procedures in a way to trick the buggy FUSE Emulator to.
We also need to change breakpoint command because the original gdb-z80 uses RST8 jump instruction for that and on the ZX Spectrum this is reserved for Interface 1 calls. And we do need Interface 1 because serial port is part of it.
To cut the long story short, you can download the code for ZX Spectrum stub from git and compile it. It is locate in yx/tools/gdb-zxspectrum-stub folder and has a Makefile to make things easier for you. This will produce the 48.rom file for you. Currently it only runs on Fuse emulator.
Allright! Let's Do It!
The whole thing is still a bit buggy since it just came out of the oven. It will be stable in a week or two. Until then you are just going to have to suffer unexpected crashes and errors.
First let us create named pipe files in your home folder. Go to your home folder and do
mkfifo rx tx
You successfully created the ~/rx and ~/tx files. Now you need to run gdb2fuse. I recommeend you copy it to /usr/local/bin where other tools reside. gdb2fuse accepts three command line arguments. The port where the IP server will listen, the input named pipe and the output named pipe. Run it by executing
gdb2fuse 6666 ~/tx ~/rx
The server will go into listening mode. Now run go to the gdb-zxspectrum-stub folder (i.e. the folder where 48.rom is) and run your ZX Spectrum emulator.
fuse --machine 48 --interface1 --rs232-tx ~/tx --rs232-rx ~/rx --graphics-filter 2x --no-rs232-handshake --rom48 48.romSpectrum's screen should be black. This signals it is in server mode and listening on the serial port for debugger's commands. Now is the time to run the GNU Debugger.
ddd --debugger /usr/local/bin/z80-unknown-coff-gdb &Then go to bottom pane and type
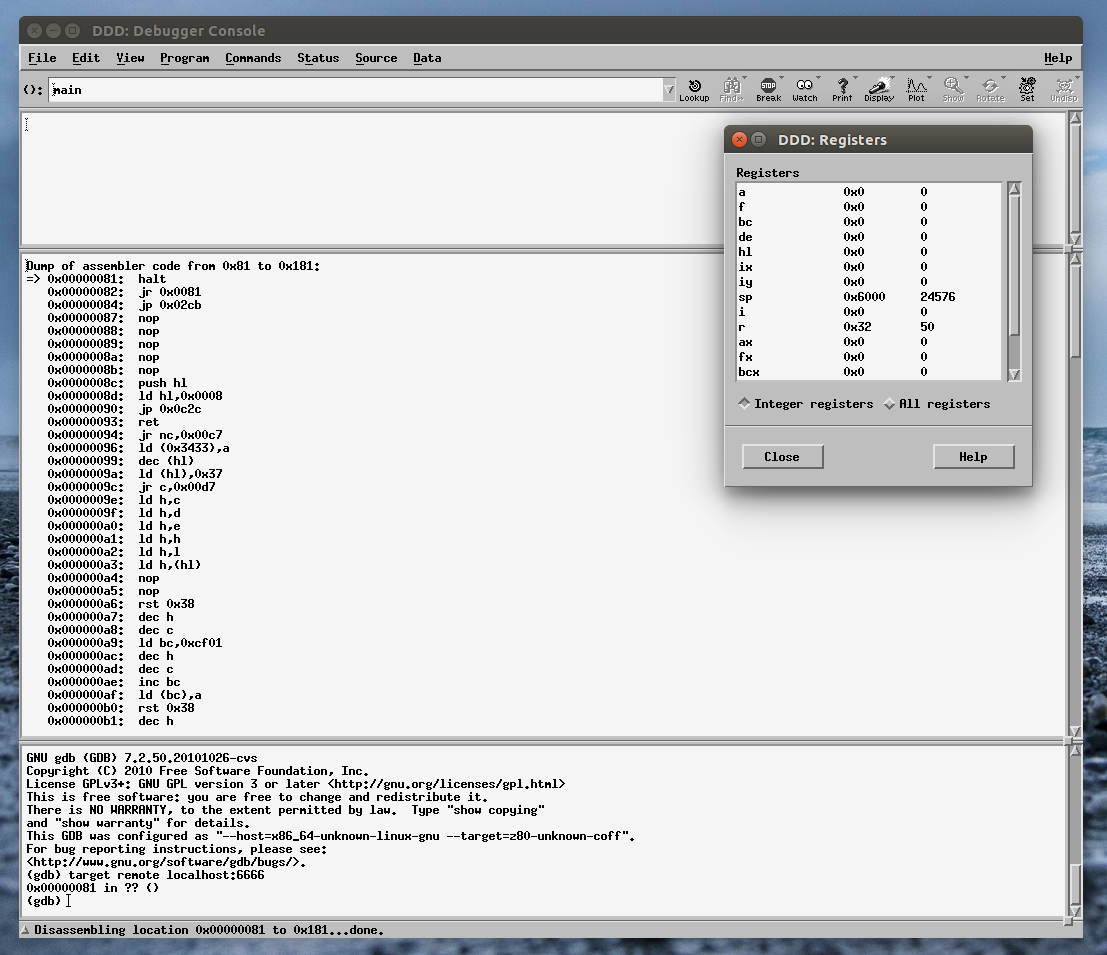
target remote localhost:6666
If all went well this is the result you get. Congratulations. You have configured GDB for remote debugging on ZX Spectrum.
In this -third- part of our tutorial we are going to compile the GNU Debugger. It was ported to the Zilog Z80 architecture by Leonardo Etcheverry and is available from his git repository. The code is old and you need to apply some hacks for it to compile.
First install some additional tools. These are not part of the standard Ubuntu installation:
sudo apt-get install ncurses-dev flex bison
GNU Debugger also requires the texinfo package. But shall avoid compiling documentation because it is outdated and recent versions of texinfo are too strict for the job.Now fetch gdb-z80 source code by first cd-ing to your ~/dev folder and executing:
git clone https://github.com/legumbre/gdb-z80.git
cd gdb-z80
You are now ready to compile. Configure the package for cross debugging. Here is the command to do it:
./configure --enable-werror=no --target=z80-unknown-coffThe target of cross compilation is z80. The --enable-werror=no switch turns off error on warning behaviour on newer versions of gcc. The code is too old to pass without warnings and we don't want them to break the compilation.
Before running make we need means to avoid compiling documentation. The tool that we strive to avoid is makeinfo which is part of texinfo package. As you can remember we did not install it. So we are going to make the make think we have it by redirecting it to another tool which will do ... absolutely nothing ... and return success. It just so happens that unix has such a tool. It's called Wine. No, wait. It is called /usr/bin/true.
So here is how we call our make file
make MAKEINFO=trueWe apply the same trick to install gdb-z80 to destination folder
sudo make MAKEINFO=true installIf everything went according to our grand plan there are two new files in your /usr/local/bin folder.
ls /usr/local/bin
z80-unknown-coff-gdb  z80-unknown-coff-gdbtui
Grand! Now install your favourite GDB GUI. I recommend the Data Display debugger. It is absolutely archaic piece of technology and brings you back to the early days of unix when Motif roamed the earth. Just the right tool for ZX Spectrum development.
Install the DDD
sudo apt-get install dddAnd test our system by passing gdb-z80 to the Data Display Debugger using the --debugger option.
ddd --debugger z80-unknown-coff-gdb &

Yaay. You have a debugger for Z80 on your system. Next time we are going to dwelve into remote debugging and step through a program on your ZX Spectrum emulator.
Till then ... be patient.
Subscribe to:
Posts
(
Atom
)